Research
Does net zero stabilize global temperatures?
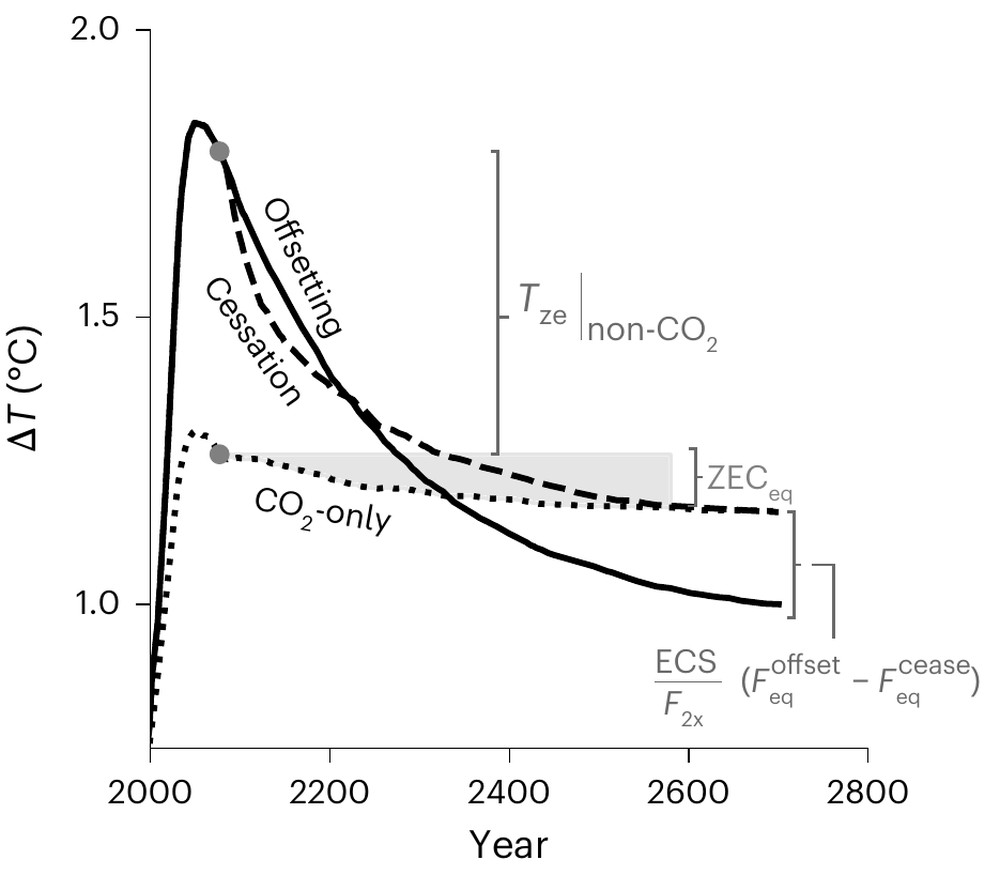
Net zero—balancing our greenhouse gas emissions with deliberate removal—is the centerpiece of climate mitigation. The goal was designed with CO2 in mind: in a CO2-only world, maintaining net zero prevents further warming for centuries, as we show with an analytic theory constrained by the best available evidence. In the real world, however, gases other than CO2 also heat the planet, and tiny particles known as aerosols cool it. Taken together, these non-CO2 effects substantially raise the temperature above what our CO2 emissions alone would produce. Because these gases are shorter-lived than CO2, reaching net-zero greenhouse gas emissions does more than stabilize the temperature: it yields a gradual cooling of at least 0.6 °C over the following centuries. See Tarshish, Jeevanjee & Fung (2026).
Which human activities have caused global warming?
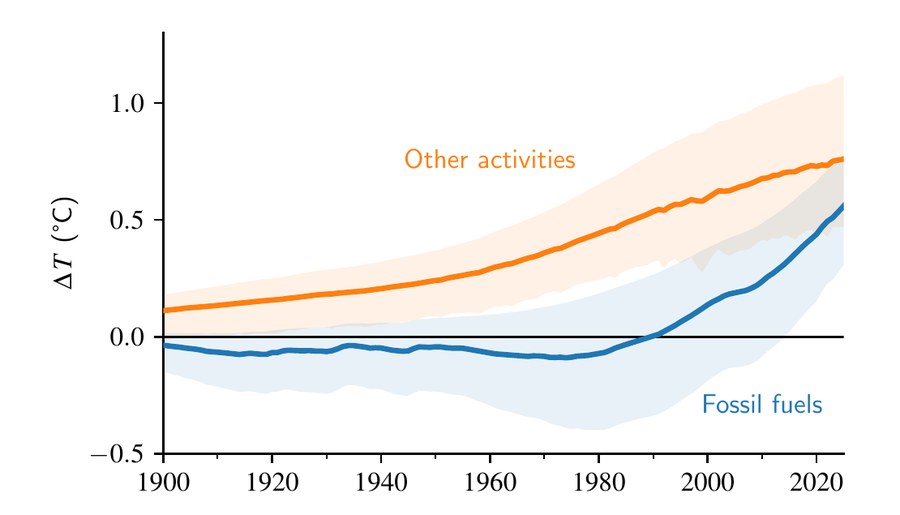
Fossil fuels are often identified as the main culprit behind global warming. But fossil fuels, particularly coal, emit sulfur as well as CO2, and that sulfur reacts with oxygen in the atmosphere to form tiny particles, known as sulfate aerosols, that reflect sunlight and cool the surface. Although these aerosols last only days to weeks before settling or raining out, ongoing fossil-fuel emissions have replenished them, giving aerosols a persistent cooling influence on global temperature. Here we show that this aerosol cooling likely outweighed the heating from fossil-fuel greenhouse gases until the 1980s, meaning that fossil fuels were a net source of cooling for most of the 20th century. Even today, because aerosol masking continues, fossil fuels likely account for less than half of the temperature rise. Most warming has instead come from non-fossil activities, primarily agriculture and land-use change. As heating from long-lived CO2 accumulates, we project that fossil fuels will become the dominant source of human-caused warming by mid-century and remain so for millennia. See Tarshish, Romps & Fung (under review).
What mechanisms drive ocean heat uptake?
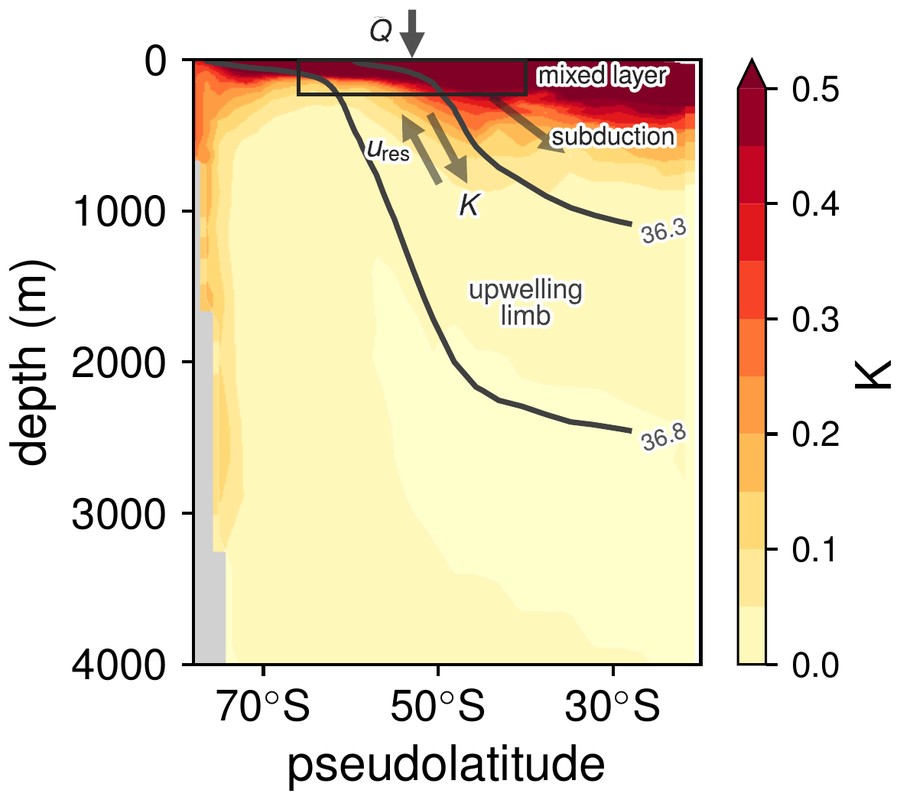
Much of the heat trapped by rising greenhouse gases flows into the ocean, roughly halving the rate of global warming we experience. Over time, however, this uptake is expected to weaken as the deep ocean itself warms. The mechanisms that set the strength of the uptake and the timing of its decline remain poorly understood, owing to the complexity of air–sea heat exchange and to changes in the ocean's circulation with warming. We perform a series of mechanism-denial experiments in a climate model to identify the dominant processes. Using a new technique that computes heat uptake with the ocean circulation fixed at its preindustrial state, we show that this fixed circulation alone accounts for most of the heat uptake in a warming climate. An analytic model explains this result through a balance in the Southern Ocean, where the circulation brings up water that has not yet warmed and mixing carries heat into the interior along surfaces of equal density. See Tarshish & Tziperman (submitted).
How high can firestorm plumes rise?
The fire ignited by the nuclear attack on Hiroshima released an order of magnitude more energy than the bomb itself. Over the burning city, a firestorm developed: air rushed in from the sides, fanning the flames, and rose in a towering plume of black soot. If such a plume climbs high enough, it places soot in the stratosphere, above the weather that would rain it out. At these heights, soot can persist for years, absorbing sunlight and shading the surface. Nuclear winter refers to the scenario in which enough soot (on the order of ten million tons) is lofted that the resulting planetary cooling suppresses crop yields and spreads famine. How many burning cities it would take to loft this much soot is not well constrained, making the risk of nuclear winter hard to evaluate.
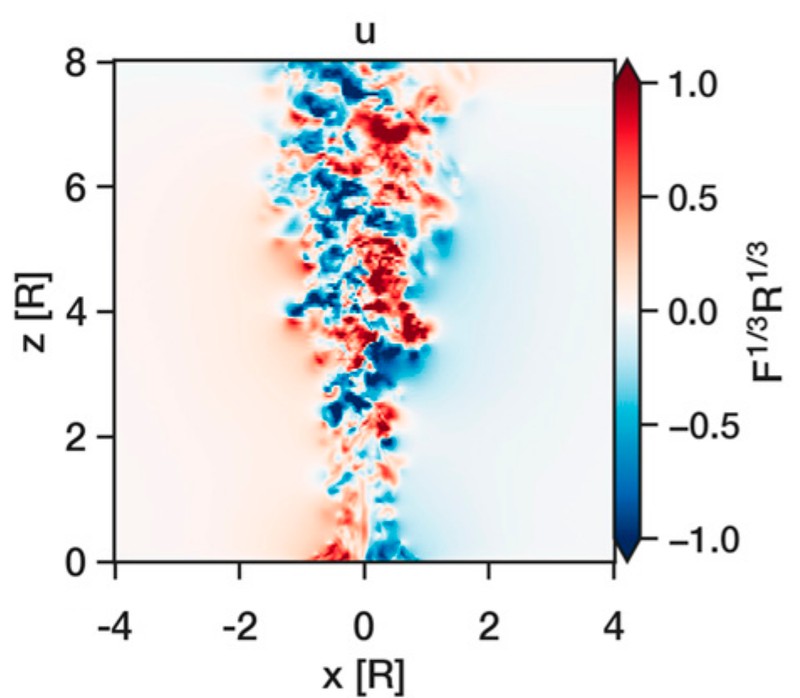
We show that the estimated heat provided by the underlying Hiroshima fire—despite its intensity—is not sufficient to loft its plume up to the stratosphere. Such a rise requires the additional source of energy found in the water vapor the plume draws in, which releases latent heat as it condenses into droplets (Tarshish & Romps 2022b). The plumes that risk triggering nuclear winter are therefore moist plumes, making firestorms in tropical environments that already support deep convection of particular concern. Predicting a plume's final height, however, also depends on capturing how the plume emerges from the turbulent flow near the ground. Using direct numerical simulations, we show that this spin-up region can be captured by treating the plume as if it rose from a point source beneath the surface, known as its virtual origin. With the virtual origin measured from these simulations, predicted plume heights are consistent with observations of the Hiroshima plume (Tarshish & Romps 2022a).
How does a cloud's shape determine its acceleration?
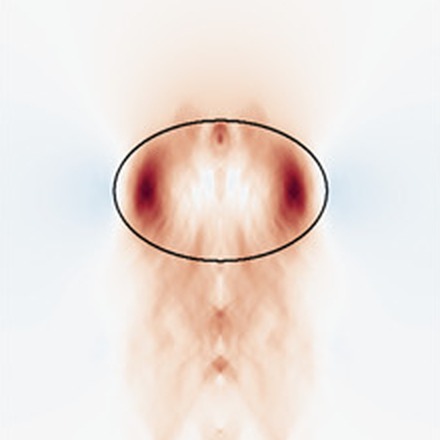
Buoyant blobs of air, known as thermals, are the building blocks of clouds. Their acceleration depends on how much lighter they are than their surroundings and on their shape, which determines how much fluid they must push out of the way as they rise.
Here we derive the exact relationship between shape and buoyant acceleration for ellipsoidal thermals. Using a mathematical equivalence with magnetostatics, we compute analytic expressions for a thermal's buoyant acceleration in terms of its aspect ratio. A spherical thermal accelerates at two-thirds of the traditional Archimedean buoyancy, (ρ′/ρ) g, and flatter, more squashed thermals accelerate more slowly. Direct numerical simulations show that the theory remains accurate even after thermals become turbulent. See Tarshish, Jeevanjee & Lecoanet (2018).
How leaky are ocean vortices?
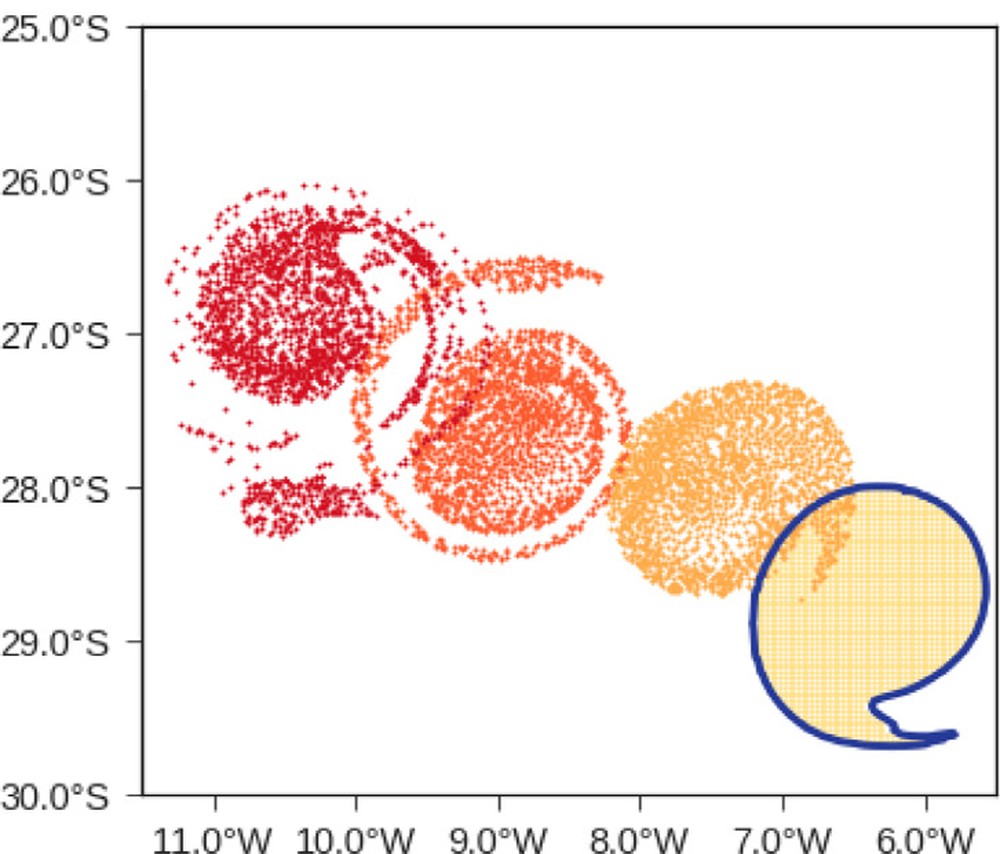
Ocean vortices trap water, heat, and other properties as they spin, but how far they carry it depends on how leaky they are. Does a vortex carry the same coherent blob of water with it, or does only the spinning motion persist while the water itself is exchanged with the surroundings?
In a high-resolution ocean model, we find a spectrum between these two extremes. Vortices are identified using the method of Haller et al. (2016), which tracks individual (Lagrangian) water parcels and finds groups of parcels that rotate together. We develop a coherency index, which measures how well a vortex's water parcels stay together. Leaky vortices outnumber strictly coherent ones by an order of magnitude, with most vortices exchanging much of their water with the environment as they spin (Tarshish et al. 2018). Further work examines how smaller-scale flows and waves affect this vortex transport (Sinha, Balwada, Tarshish & Abernathey 2019).